This data-driven story gives a detailed breakdown of Americans’ Social Security benefits, plus the Cost-of-Living Adjustments (COLAs) that the government uses to help them keep pace with inflation. Whether you’ve come from one of our press releases, our Advisor newsletter, the TSCL website, or your favorite search engine, we’re excited to help you learn more about Americans’ Social Security benefits.
Be aware: This page is a deep dive, so expect to see a fair amount of detail. It will answer a few key questions:
- How much are Social Security benefit payments?
- What is the COLA for 2026, and what will it be in 2027?
- What does the historic COLA trend look like?
- How is the COLA currently calculated?
- How could we calculate a better COLA that is fairer for American seniors?
How much are Social Security benefit payments?
How much the Social Security Administration (SSA) pays Americans every month varies greatly depending on the individual. The formula depends on a range of factors, such as your lifetime earnings, number of working years, marital status, and the age you start collecting benefits.
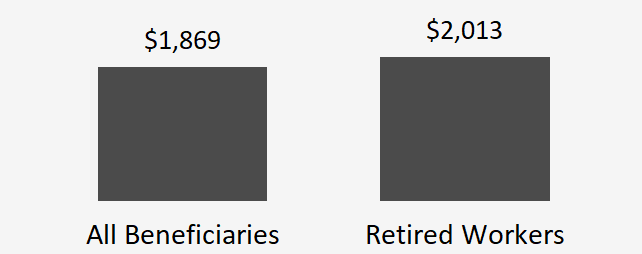
The SSA reports a new average Social Security payment every month. The average monthly check for all beneficiaries was $1,869 in November 2025, the most recent month for which data are available, as shown in the figure below. For retired workers, the average monthly check was $2,013. The amount for retired workers is higher because it does not include people on disability or survivor benefits, which tend to be lower than retirement benefits.
Average Social Security Benefits as of November 2025
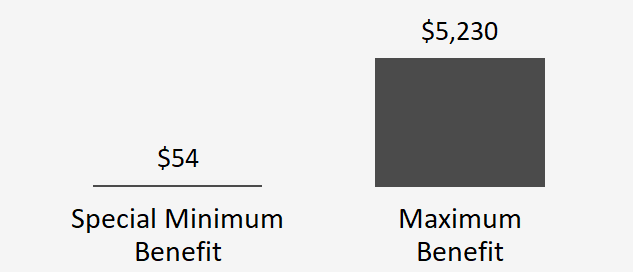
However, many people on Social Security receive checks that are far different from the average payments. In reality, your monthly payment could fall anywhere from $54 to $5,230 in 2025, as shown in the chart below.
So, you might ask, why are payments so spread out? Why do some Americans bring home so much more from Social Security than others?
Minimum and Maximum Social Security Benefits for 2025
Let’s start at the lower extreme. Social Security’s lowest possible payment, the Special Minimum Benefit. Introduced in 1972, it’s a minimum payment to ensure that Americans with a substantial work history but low lifetime earnings receive Social Security benefits. It is calculated based on the number of years someone has worked and paid Social Security payroll taxes and does not consider how much they made each year.
Americans must show 11 years of work history to qualify for the minimum $54 payment, but this increases with each additional year of work history. At most, the Special Minimum Benefit is $1,123 in 2025 for beneficiaries who have 30 years of work history. You can learn more about how this payment changes depending on a beneficiary’s years of work experience at this SSA webpage.
At the other end of the extreme is the Maximum Social Security Benefit, which is the absolute most that the SSA will pay any beneficiary in a given month. The Maximum Social Security Benefit exists because there’s a cap on how much of your earnings are subject to Social Security payroll taxes, which the SSA updates every year. (The cap in 2026 is $184,500.)
Essentially, you have to meet three criteria to qualify for the Maximum Social Security Benefit:
- Your Social Security payroll tax contributions reach the cap 35 times in your career. (Few Americans hit the cap once, let alone 35 times.)
- You must wait until age 70 to begin claiming retirement benefits. That’s when the SSA stops raising your principal insurance amount—basically, a baseline used to calculate your benefits—to incentivize you to put off claiming your benefits.
- You must be born in the right year. The principal insurance amount, the baseline used to calculate your benefits, changes with every birth year, with the most recent cohort to turn 70 being eligible for the highest amount.
Want to see where you fall? You can estimate your benefit amount using this calculator from the SSA.
What is the COLA for 2026, and what is the predicted COLA for 2027?
The average Social Security benefit changes every year when the SSA announces its annual Cost-of-Living Adjustment or COLA. Designed to help benefits keep pace with inflation over time, the COLA is announced in October of each year and implemented the following January.
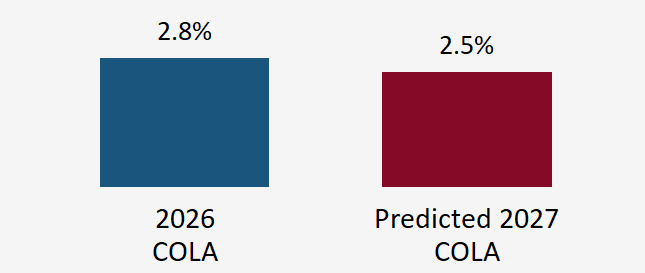
The COLA for 2026 is 2.8 percent, which is slightly higher than the COLA of 2.5 percent implemented at the start of 2025. TSCL predicts that the COLA for 2027 will be 2.5 percent, as shown in the figure below.
Predicted COLA for 2027
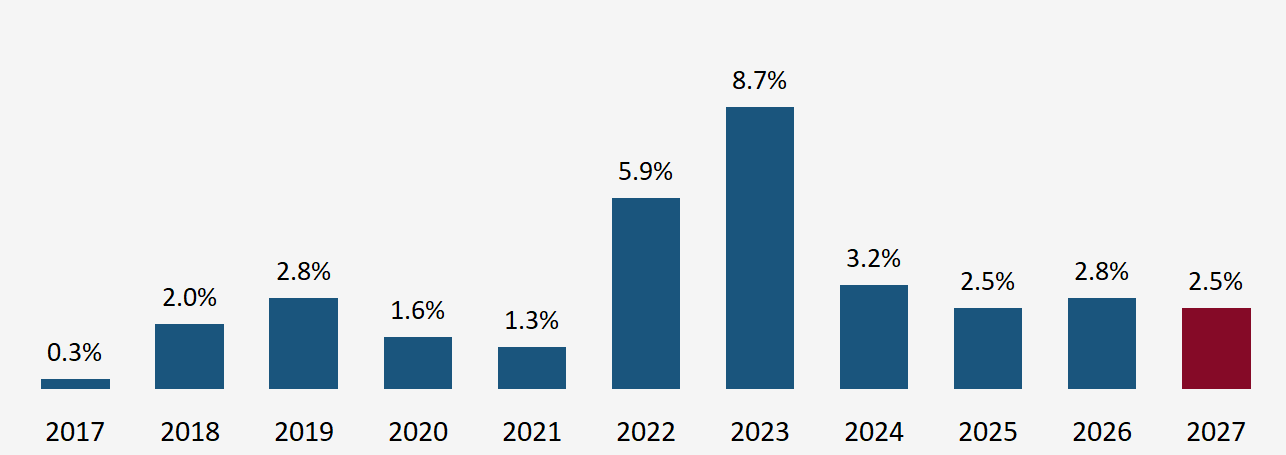
From a historical perspective, TSCL’s predicted 2027 COLA would rank 35th among the COLAs implemented since 1977, which was the first year that the SSA began calculating COLAs based on the CPI-W. The last COLA, announced in 2025 and implemented in 2026, ranks 28th. You can see how the 2026 COLA compares to the last 10 COLAs in the figure below.
Predicted 2027 COLA vs. Last 10 COLAs
How could we calculate a better COLA that is fairer for American seniors?
One major issue with Social Security’s COLAs is that they don’t keep up with inflation as seniors experience it. According to TSCL’s 2024 Loss of Buying Power report, the average Social Security payment has lost approximately 20 percent of its buying power since 2010.
Why do COLAs fail to keep up with seniors’ economic experiences? A lot of it has to do with the economic indicator the government uses to calculate the COLA.
Right now, the government calculates each year’s COLA by taking the average of the Consumer Price Index for Urban Wage Earners, or the CPI-W, from July to September of each year. The CPI-W is a price index published monthly by the Bureau of Labor Statistics (BLS) that measures the cost of more than 200 common household expenses, grouped into categories such as housing, food, and transportation. The problem is that the CPI-W measures changes in prices for urban wage earners, whose budgets look a lot different than a typical senior’s.
One alternative to calculating COLAs with the CPI-W would be doing so with the CPI-E, or the Consumer Price Index for the Elderly. Although this price index, also published by BLS, uses the same inputs as the CPI-W, it weights them differently to look more like a typical American senior’s budget.
You can see a comparison of the expense category weights for the CPI-W and the CPI-E in Table 1, below. Notice how both sets of weights add up to 100, representing approximately how much of the typical person’s budget goes toward each expense category. Now, look at the differences.
Table 1: Comparing Expense Category Weights for the CPI-W and CPI-E
| Category | CPI-W | CPI-E | Higher |
|---|---|---|---|
| Housing | 41.932 | 48.051 | CPI-E |
| Transportation | 19.290 | 13.966 | CPI-W |
| Food and Beverages | 15.959 | 13.223 | CPI-W |
| Medical Care | 6.946 | 11.296 | CPI-E |
| Education and Communication | 5.534 | 3.652 | CPI-W |
| Recreation | 4.499 | 5.097 | CPI-E |
| Apparel | 2.751 | 1.863 | CPI-W |
| Other Goods and Services | 3.089 | 2.853 | CPI-W |
| TOTAL | 100.000 | 100.000 |
The CPI-E reflects that, in general, seniors spend more of their budgets on housing, medical care, and to a lesser extent, recreation than people who live in cities and earn their income by working. Meanwhile, it shows that seniors tend to spend less on things like transportation, food and beverages, education and communication, and apparel.
That’s not the only place where the CPI-E differs from the CPI-W, though. Over time, because it emphasizes expenses in different parts of a person’s budget, the CPI-E has generally recorded higher inflation than the CPI-W.
As shown in Table 2, below, if the government calculated the COLA with the CPI-E instead of the CPI-W, the COLA would have been higher in seven of the last 10 years for which data are available. On average, the COLA would be about 2.8 percent with the CPI-W and 3.0 percent with the CPI-E.
However, TSCL believes that just switching the COLA calculation to use the CPI-E doesn’t go far enough. Instead, we calculate that the government uses what we call the CPI-BEST to calculate the COLA.
The CPI-BEST would guarantee a minimum COLA of 3.0 percent, but in years where inflation came in higher than that, calculate the COLA using the better of the CPI-W or the CPI-E. If the government used the CPI-BEST to calculate the COLA, the average COLA for the last 10 years would be about 4.0 percent, compared to 2.8 percent using the CPI-W.
Table 2: Last 10 COLAs Calculated with the CPI-W, CPI-E, and CPI-BEST
| Year | CPI-W (Current) | CPI-E (Better) | CPI-BEST (TSCL Preferred) |
|---|---|---|---|
| 2017 | 0.3% | 1.5% | 3.0% |
| 2018 | 2.0% | 2.1% | 3.0% |
| 2019 | 2.8% | 2.6% | 3.0% |
| 2020 | 1.6% | 1.9% | 3.0% |
| 2021 | 1.3% | 1.4% | 3.0% |
| 2022 | 5.9% | 4.8% | 5.9% |
| 2023 | 8.7% | 8.0% | 8.7% |
| 2024 | 3.2% | 4.0% | 4.0% |
| 2025 | 2.5% | 3.0% | 3.0% |
| 2026 | 2.8% | 3.1% | 3.1% |
Over time, switching the COLA calculation to a better inflation index would have a profound impact on seniors’ benefits and financial health. A 2025 TSCL analysis shows that even using the CPI-E, not the CPI-BEST, would have resulted in approximately $5,000 in additional benefits for the average person who retired in 1999. If inflation trends over the last 25 years continued, TSCL calculated that the average person who retired in 2024 would bring in more than $12,000 of additional benefits over a 25-year retirement using the CPI-E to calculate COLAs.
